

Published at Sep 17, 2021

Sine wave gratings are a popular visual stimulus in vision research, used for all kinds of cognitive and behavioral experiments. This is in part due to their great coverage of the receptive field, but also due to their manipulation possibilities: following a simple wave function, the frequency, phase and angle of the grating can be easily altered. To this end, a popular Python library for such manipulation is PsychoPy. While this is library is great for running in-vivo experiments, it falls short for researching deep nets because:
Creating PsychoPy gratings requires a monitor configuration, which is uncommon for computing clusters on which experiments are often run;
Loading PsychoPy gratings as model inputs requires saving the gratings as an image and loading them into memory, which is needlessly complicated;
Installing new libraries introduces dependencies and can lead to version conflicts.
To generate gratings in NumPy, we will utilize the numpy.meshgrid() function:
# Get x and y coordinates
x, y = np.meshgrid(np.arange(imsize), np.arange(imsize))
This function creates a 2D map for the x and y coordinates on a 2D plane. The variablesx and y are 2D gratings in their respective, orthogonal directions. In general, the numpy.meshgrid() function is useful for evaluating functions in 2D space. Using trigonometry, we can combinex and y into a single gradient of a particular orientation as follows:
# Get the appropriate gradient
gradient = np.sin(ori * math.pi / 180) * x - np.cos(ori * math.pi / 180) * y
where ori is the orientation angle in degrees.
To generate a grating, all we need to do is plug the angled gradient into a wave function. The phase and spatial frequency are parameters of this wave function. In Python this looks as follows:
# Plug gradient into wave function
if wave is 'sin':
    grating = np.sin((2 * math.pi * gradient) / sf + (phase * math.pi) / 180)
elif wave is 'sqr':
    grating = signal.square((2 * math.pi * gradient) / sf + (phase * math.pi) / 180)
This code supports sine and square wave functions. While these are most frequently used in research, other wave functions can also be used.
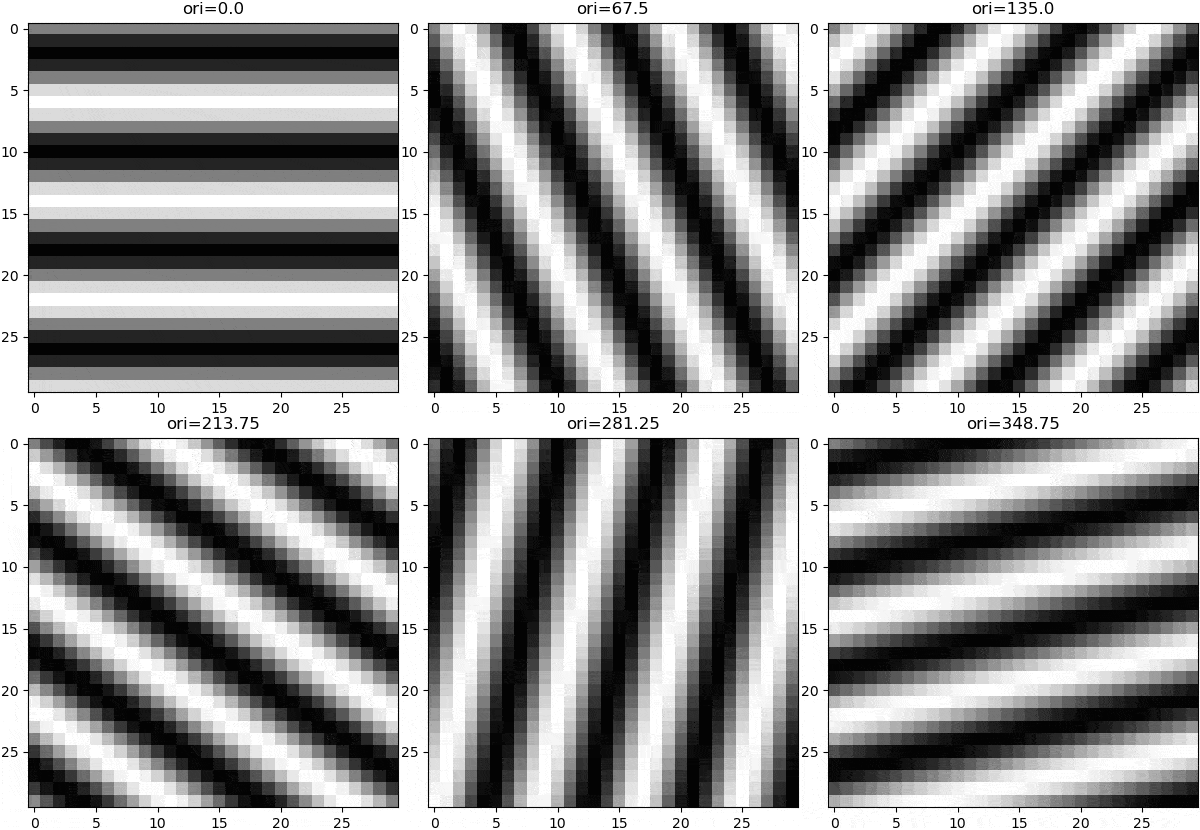
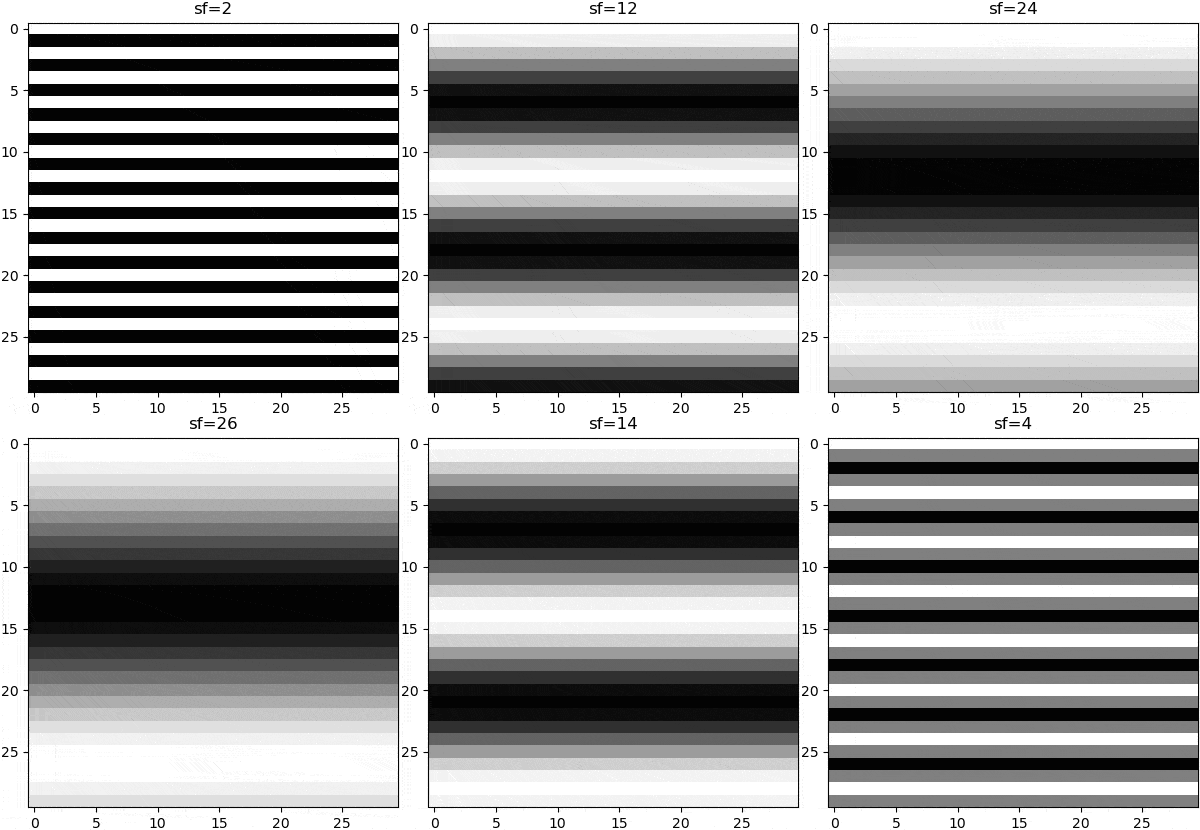
The parameters of a wave can be manipulated to change the appearance of that wave, and thus the subsequent grating. Although these parameters can be nonlinear (e.g. sin(x**2)), grating stimuli are typically of no such complexity. Rather, there are three parameters that are linearly manipulated. Firstly is the wave orientation, which is is manipulated by changing the axis of variance in our computed gradient. Secondly is the wave frequency, which is manipulated by multiplying the wave function argument with a scalar. Thirdly is the phase, which is manipulated by adding a constant to the wave function argument, so as to create a wave offset.


import math
import matplotlib.pyplot as plt
import numpy as np
import scipy.signal as signal


def create_grating(sf, ori, phase, wave, imsize):
    """
    :param sf: spatial frequency (in pixels)
    :param ori: wave orientation (in degrees, [0-360])
    :param phase: wave phase (in degrees, [0-360])
    :param wave: type of wave ('sqr' or 'sin')
    :param imsize: image size (integer)
    :return: numpy array of shape (imsize, imsize)
    """
    # Get x and y coordinates
    x, y = np.meshgrid(np.arange(imsize), np.arange(imsize))

    # Get the appropriate gradient
    gradient = np.sin(ori * math.pi / 180) * x - np.cos(ori * math.pi / 180) * y

    # Plug gradient into wave function
    if wave is 'sin':
        grating = np.sin((2 * math.pi * gradient) / sf + (phase * math.pi) / 180)
    elif wave is 'sqr':
        grating = signal.square((2 * math.pi * gradient) / sf + (phase * math.pi) / 180)
    else:
        raise NotImplementedError

    return grating


if __name__ == '__main__':
    plt.imshow(create_grating(sf=8, ori=45, phase=0, wave='sin', imsize=30))
    plt.show()